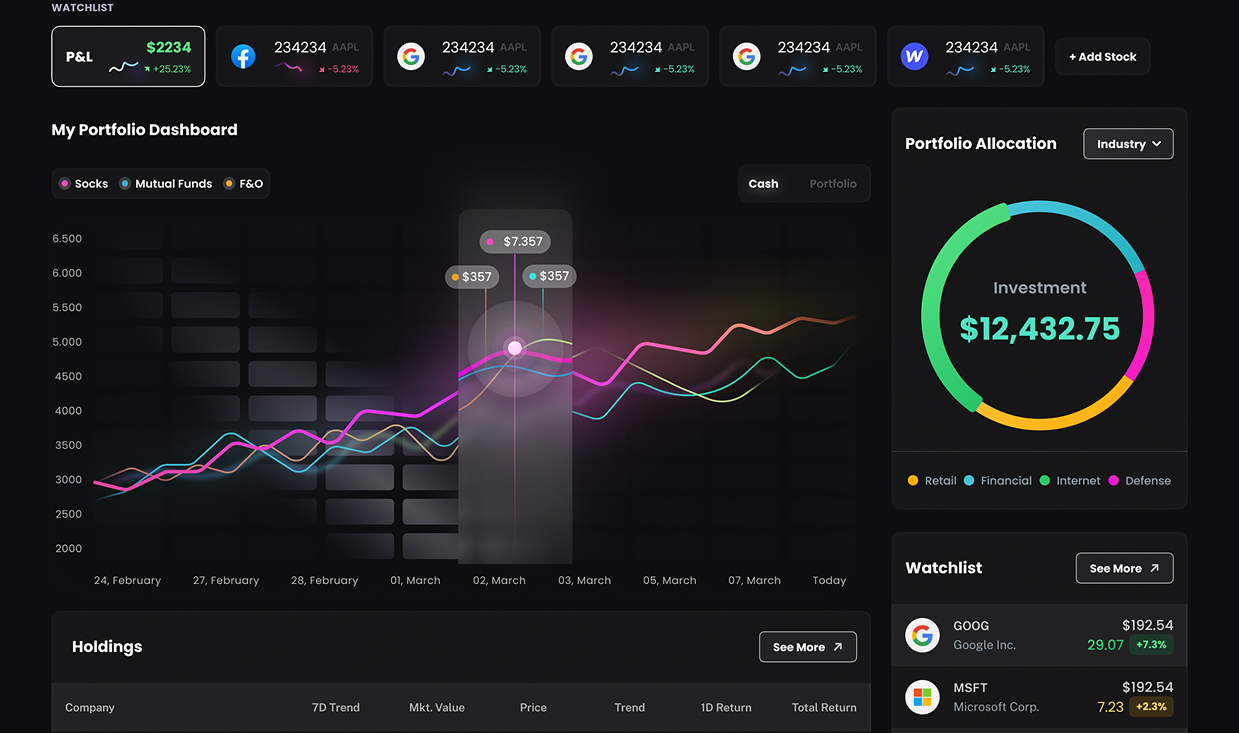
Renvex Market Heatmaps
Live Intelligence. Structured for Precision.
Gain a real-time visual overview of global markets — all in one analytical space. Renvex Heatmaps translate complex data into clear visual signals, helping traders identify liquidity shifts, performance clusters, and volatility hotspots across forex, equities, crypto, and other key assets.
Clarity at speed. Insight at scale.


Currency Flow, Mapped in Real Time
Forex Overview Map
Watch currency strength evolve tick by tick.
Analyze momentum between major pairs, identify relative performance, and detect volatility clusters instantly.
A live visual matrix designed to turn macro movements into actionable signals.
See Market Leaders and Laggards Instantly
Equity Performance Grid
Visualize equity strength and sector rotation across global exchanges. Track capital flow between industries, compare performance ratios, and pinpoint where momentum is accelerating or fading — all in one dynamic interface.
Real-Time View of the Crypto Ecosystem
Digital Asset Matrix
Capture market shifts across digital currencies with precision.
Monitor live volatility, price deviation, and liquidity movements to spot structural patterns in the crypto landscape before they unfold.
Perfect for traders who move where momentum meets data.
A Complete Visual Breakdown of Market Activity
Asset Analytics Board
Go beyond price charts — explore live data on performance variation, volatility range, and percentage changes across instruments.
The Renvex Asset Board consolidates this data into a single, intuitive view to empower evidence-based portfolio decisions.